Financial analysis requires the use of financial data for a company’s performance assessment and making decisions to improve the processes. Financial analysis is usually carried out with the help of tables such as Excel, etc., which are able to store, project and analyze large amounts of data. Of course, financial analysis does not have a specific method, and each company, based on its needs, may choose one of the methods of financial analysis to assess its status.
Read More : What is financial forecasting and how is it performed?
Table of Contents
Common types of financial analysis :
- vertical
- horizontal
- leverage
- growth
- profitability
- liquidity
- efficiency
- cash flow
- rates of return
- valuation
- scenario
- sensitivity and variance analysis.
Financial analysis : Vertical analysis
In this type of financial analysis, different components of the income statement are examined and divided into the company’s profit to be expressed as a percentage. For the effectiveness of this method, the results must be compared with the performance of other companies to determine the exact position of the company in the market. This process allows analysts to compare companies with different dimensions and sizes with the help of their profit margins.
Horizontal analysis
Horizontal analysis uses several years of financial data stored by the company to calculate growth rates. This type of analysis allows the company to have an understanding of the upward or downward trend of its performance over the coming years and also to be able to identify the main trends in the market. This financial model is based on the financial data of the company for at least the past 3 years to estimate the future of the company within about 5 coming years. The analysis the data during these 8 years, allows us to identify the mainstream in the market, which can be a trump card against similar competitors in the same industry.
Leverage analysis
One of the most common methods of financial analysis for the performance evaluation of a company are leverage ratios. Similar to other financial metrics, leverage analysis cannot be specifically meaningful; therefore, it is used for making comparisons and depicting a general picture.
Growth rates another kind of financial analysis
Analyzing growth rate data and forecasting the future is one of the most important goals of financial analysis. Year-over-Year (YoY), regression analysis, bottom-up analysis and top-down analysis are some of the methods for future forecast.
Profitability analysis
Profitability is a kind of income statement analysis in which the analyst evaluates the economic and financial potential of a business. For example, gross margins, profit before interest and taxes EBIT margin, net profit margins are some methods of profitability analysis.
Liquidity analysis
Liquidity analysis is a type of financial analysis that places a big emphasis on the balance sheet and the ability of the company to meet its obligations in the short term (less than one year). Examples of liquidity analysis include current ratio, acid test, cash ratio, and net working capital.
Efficiency analysis
Efficiency ratios are considered as an integral part of any applied economic analysis. The ratios in this analysis method examines how to manage assets and generate profit and cash flow. Some instances include asset turnover ratio, fixed asset turnover ratio, cash conversion ratio, and inventory turnover ratio.
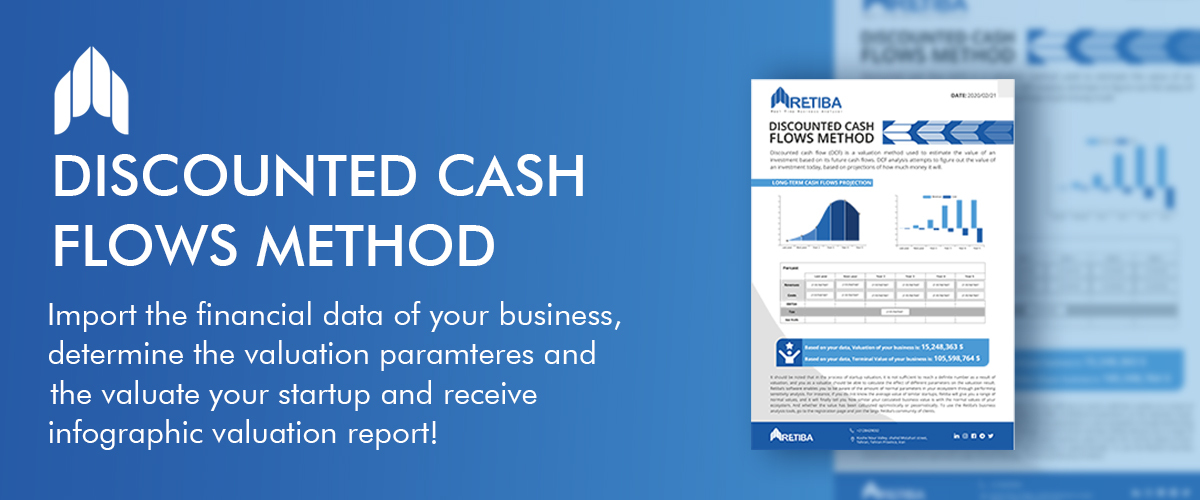
Cash flow
Having sufficient liquidity is one of the main conditions for the proper function of a business. For this reason, some analysts see the company’s ability to generate cash flow as a robust way to financially analyze the business. To do this, operating activities, investment activities and financial activities are usually reviewed. Methods such as Operating Cash Flow, Free Cash Flow, Free Cash Flow to the Firm, and Free Cash Flow to Equity are among the cash flow-based analysis methods.
Rates of Return
Ultimately, what determines a company’s profit and loss is the rate of return on investment that an investor has made in a business. In general, the rate of return on investment is determined by the amount of risk of repaying the money invested. The most common methods of analysis in this way are return on equity (ROE), return on assets (ROA), return on investment (ROIC), dividend yield, capital gain, accounting rate of return (ARR), and internal rate of return (IRR).
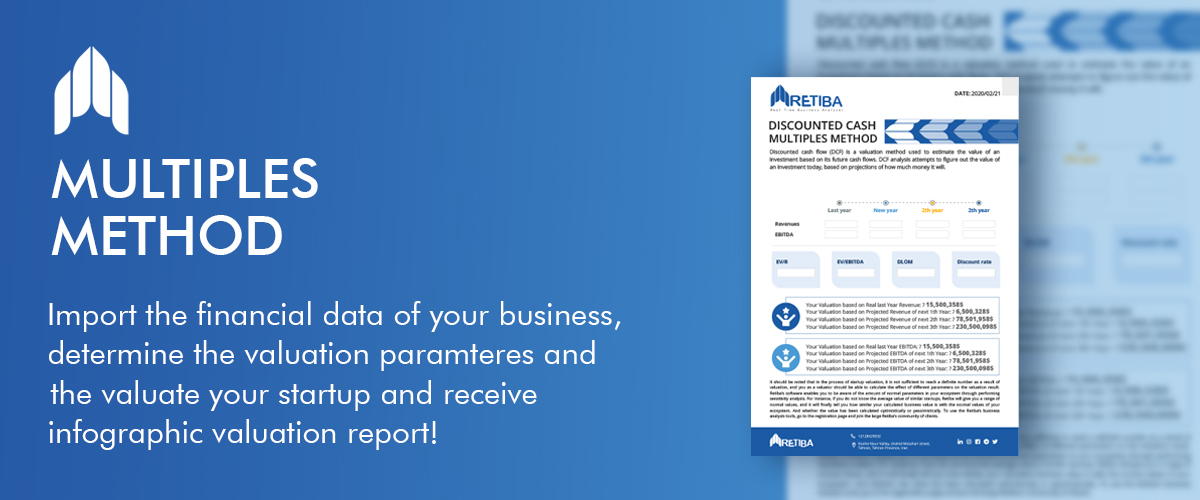
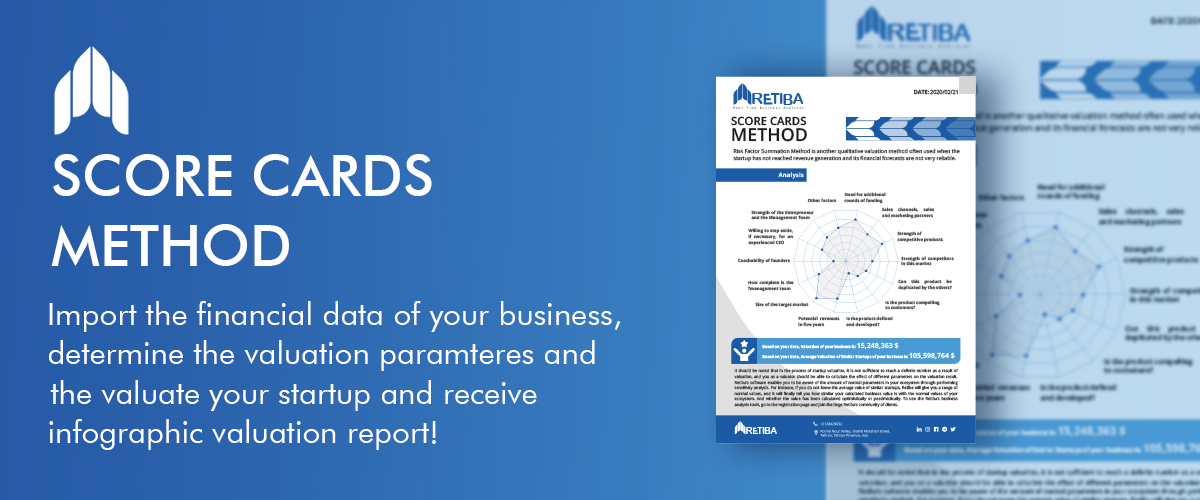
Valuation analysis
Determining a business’s value is one of the essential indicators of financial analysis on which investment professionals in any industry spend a lot of time and energy. The value of a business is assessed in different ways. The final result is usually obtained by combining several different methods including cost method (the cost to build or replace), relative value (comparative analysis of the company and analysis of precedent transactions) and intrinsic value.
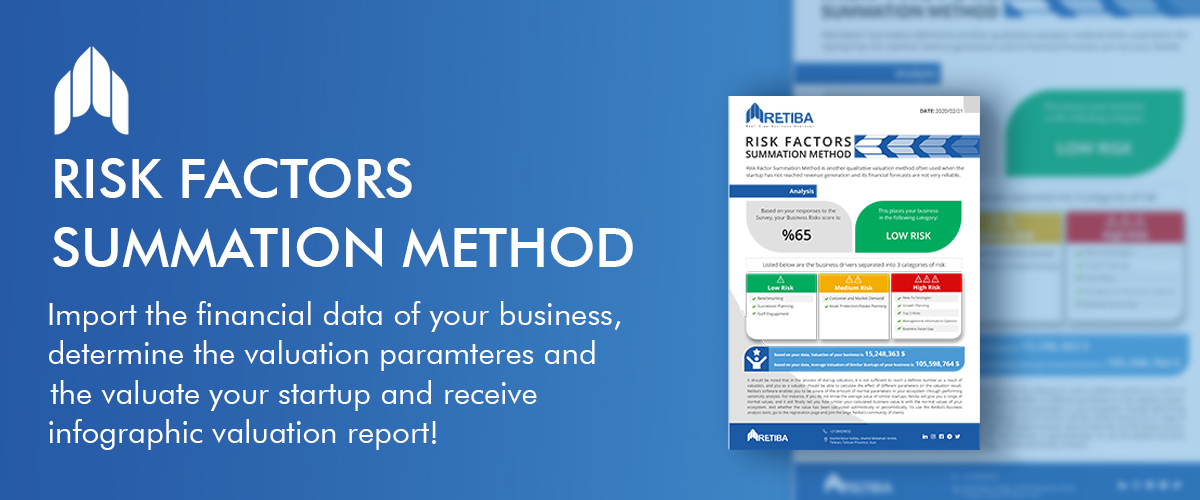
Sensitivity and scenario analysis
Other components of the company’s financial modeling are evaluating its performance in different scenarios and sensitivity analysis, which helps to assess the amount of risk. In this method, the worst possible scenario for the company in the future is considered and the conditions are examined. The company usually considers the budget and the necessary measures to deal with the possible scenarios in all its decision-makings. Investment analysts also measure investment risk according to the sensitivity of the company’s output to various changes and scenarios.
Analysis of variance
Analysis of variance is a process for making comparison between the actual results and the budget or forecast. This analysis provides important information contributing to several issues in internal planning and budgeting operations. The variance index is examined and its acceptability is evaluated in this analysis method. If the variance is not acceptable, it is tried to determine the main reasons for this deviation from the forecast. For example, suppose a company has a budget of $ 2.5 million for a project while the project requires $ 2.6 million in practice. This means a variance of $ 0.1 million.
Conclusion of financial analysis :
All of the above mentioned methods of financial analysis are commonly applied. For each of these methods, different functions, formulas and tables are defined to evaluate the performance of companies. However, one or more methods usually provide better and less erroneous results for each business. The best method for a business is the one that is able to organize its data well, make formulas and calculations as simple and understandable as possible, provide the possibility of process monitoring, and take into account the details of the company’s status.
Learn More :
wikipedia.org : They’re the masters of financial analysis