Do you want to get more organic traffic to your website? Do you want wider access to social media? Or get higher Click Through Rate via email? These are all goals you can achieve through data collection and analysis over time. There are a number of key performance indicators in digital marketing with which you can evaluate your campaigns, sales conversions and brand awareness. When it comes to digital marketing evaluation, a number of key performance indicators come to mind. In this article, 18 key performance indicators of digital marketing, which are among important issues to consider, are going to be enumerated and discussed separately.
How to Choose Key Performance Indicators for Our Business?
key performance indicators of digital marketing are related to website traffic
Since your website traffic reflects your business growth, the indicators related to website traffic are among the most important key performance indicators of digital marketing, and the first 10 key performance indicators of digital marketing are related to website traffic. Google Analytics is one of the tools for measuring and monitoring these indicators.
1- Website Traffic
Your business website serves as your home and brand, so all your digital marketing efforts are likely to be displayed on your website. Although campaigns focus on increasing social media access, their ultimate goal is to bring more browsers to your business website. If you are still witnessing a steady decline in traffic despite all the efforts of your business marketing team, you should think of troubleshooting your website your the technical issues of which has led to restraining visitors.
Here are some tips contributing to your website traffic increase:
- Optimize all your website pages with related keywords.
- Constantly publish relevant content on your weblog.
- Advertise your content on social media channels.
- Create targeted ads to get to your website landing page.
2- Traffic By Source
Another indicator of digital marketing is website traffic based on different sources. This indicator shows you exactly where your website visitors came from. Evaluating and analyzing this indicator will show you which traffic source you have to be more focused on.
The figure above shows four main sources of website traffic generated by Google Analytics:
Organic Search: These users have entered your website by clicking on the link they searched for.
Direct Visitors: These users have typed your URL exactly in the search bar and visited your website.
Referrals: These visitors did not enter your website address directly, but were referred to your website through a link on another website.
Social: As it turns out, these users came to your website by finding your profile or content on social media.
3- New Visitors vs. Returning Visitors
This key performance indicator of digital marketing will help you evaluate the content of your website over time. The number of visitors who visit your website several times over time indicates that the information and content you provide is valuable to users. When you publish new content on a regular basis, you can use this indicator to review any generated content.
If you are looking for increasing organic traffic to your website, new visitors are to be considered.
Bear in mind the following points about this indicator:
- Generate and publish valuable content on your weblog.
- Use Twitter to promote your weblog posts and their related hashtags.
- After posting new content on the weblog, encourage subscribers to visit the website by sending emails.
4- Sessions
Sessions is the number of your website visits. Google calculates this indicator based on the duration of 30 minutes; simply put, this key indicator stores the performance of all user activities such as clicks and any other actions for a default period of 30 minutes. Note that you can change the session time according to your goal. Suppose a user enters your website, and a session is defined for him as soon as he logs in. Now suppose that the same user does not take any actions on the website within 30 minutes; therefore, his session ends and if he takes any actions after 30 minutes, Google defines a new session for him.
5- Average Session Duration
Depending on your business and website performance, the duration of each session on your website can vary. According to research conducted by the Brafton, the following statistics are provided for the Average Session Duration for each industry separately.
Average Session Duration is one of the key performance indicators of digital marketing which shows the amount of time visitors spend on your website. This indicator also helps you evaluate your site performance from UX perspective.
The key performance indicator of Average Session Duration is an indicator helping you find answers to the following questions:
Is your website fast? Do users quickly find what they are looking for? Is there valuable content on your website?
Here are some tips to increase Average Session Duration:
- Add video content to your blog.
- Use tricks to persuade your users to stay connected to your website.
- Pay attention to the issues related to the appearance and readability of your content such as font type and size, background, etc.
6- Page Views
This digital marketing indicator shows the total number of page views, and it is one of the most important indicators of website traffic.
It is of great importance to know how many pages of your website have been visited in a given period of time. This key performance indicator helps you realize that your entire website is valuable to visitors or only certain pages are noticeable for them.
7- The Most Visited Pages
The key performance indicator of the most visited pages is used to determine which parts of your website are valuable to visitors. This indicator is available in Google Analytics in the Behavior Flow section.
8- Exit Rate
One of the most important performance indicators that has a lot to do with website design and user experience is the key performance indicator of exit rate. If your business campaign is going to attract new users to your website, Bounce Rate shows exactly where and after seeing which content users have left your website. As shown in the figure below, Bounce Rate indicates when a user logs out of the website without making another action on the same page, but as far as Exit Rate is concerned, the user enters the site, visits other pages and then exits the website; in this case, Exit Rate is related to the last page visited by the user.
Exit Rate and Bounce Rate are calculated according to the following relations.
9- Bounce Rate
Another key performance indicator in digital marketing is Bounce Rate. As mentioned in the previous indicator, it shows the number of users who leave your website after viewing just one page.
Increasing the Bounce Rate can be due to the following:
- Loading the website is too long.
- Users could not easily find the content they were looking for.
- Users will encounter an error page.
- Users have found the content they want but are not encouraged to click more on the website.
The following figure shows the average Bounce Rate for some websites.
Here are some tips to help you reduce your website’s Bounce Rate:
- Reduce your website’s opening time.
- Add internal links to your page.
- Use images in your content.
- Use call-to-action.
10- Conversion Rate
Another key performance indicator in digital marketing representing the number of conversions done on your site is the conversion Rate. This indicator may have different meanings depending on your business campaigns. For example, it may include sales, sharing, registering on the website, etc. Conversion Rate is often used as an indicator of digital marketing to measure the effectiveness of a campaign so that it determines whether your activity has been effective or not. This is, however, only a part of digital marketing strategy for your business.
The second part of the article
Although we have reviewed 10 key performance indicators in digital marketing so far, digital marketing indicators are not limited to these indicators. The following indicators are also included in the category of digital marketing key performance indicators which will be discussed below.
- Indicators of social networks
- Advertising indicators
- Email Marketing Indicators
11- Impressions
This digital marketing indicator is sometimes confused with Social Reach which will be described below. Impressions indicator shows the number of views of your content or ads.
Your content on social media may be viewed several times by one person, and each time is counted as an impression, so this indicator is always higher than Social Reach, because it is only considered once for each user.
12- Social Reach
The posts you generate on social media are intended to reach a large number of users. This indicator shows you exactly how many people have viewed your content. Social Reach is always higher than Social Engagement. On average, Social Engagement is usually 2 to 5% of Social Reach. One of the most important ways to increase this indicator is to continuously add the content that you have generated and to engage with your target audience.
13- Social Engagement
Social Engagement is an indicator that shows the level of user interaction with the post published on the social network. User interaction can include, click, share, like, retweet, comment, etc. Social Engagement is one of the most important indicators in the social networks.
This indicator occurs when the user has a reaction to your post and published content, so you can easily evaluate and categorize your content based on user interaction and it will help you a lot in producing the following contents.
14- Email Open Rate
This indicator is one of the most important email marketing indicators and it shows the rate of your opened emails compared to the total number of sent emails. The high rate of this indicator shows:
Low Email Open Rate indicates that at least one of the above-mentioned factors has not been met.
The chart below shows which factors are influential in Email Open Rate and its increase.
15- Click-Through Rate
Click-Through Rate or CTR can be used as one of the indicators of email marketing or payable advertising. CTR, as it is related to Pay Per Click, also affects Cost Per Click, which is described below.
16- Cost Per Click
Another key performance indicator in digital marketing is Cost Per Click or CPC. This key performance indicator, which is related to online advertising, shows the amount of money per click. CPC is important because it is directly related to your marketing budget.
17- Cost Per Conversion
This indicator directly depends on the business model and most of your online campaigns. As mentioned earlier, not every indicator is suitable for every campaign. For example, if you do not want to sell directly online, Cost Per Conversion is not a good indicator, but if you have an e-commerce website where users can create a basket purchase, measuring your CPC is essential. This analysis shows you how much it costs to convert a visitor into a customer and generate sales on the website.
18- Cost Per Acquisition
Cost Per Acquisition or CPA is another key performance indicator in digital marketing that represents the total cost of attracting customers through a particular campaign or channel.
Average Session Duration Index is one of the key indicators of digital marketing performance, it shows the amount of time visitors spend on your website. This indicator also helps you evaluate how your site is performing from a UX perspective.
It should be noted that the selection of key performance indicators for a business is influenced by the maturity level of the business, the market in which it operates, the competitive environment and many other factors that require sufficient knowledge and experience. Retiba’s experts are ready to carefully evaluate your startup business model, select key performance indicators, and analyze your business performance. All you have to do is enter your information in the evaluation application form and wait for Retiba’s experts to contact you.
What stage is your startup at? Value your startup online with Retiba’s software free of charge.
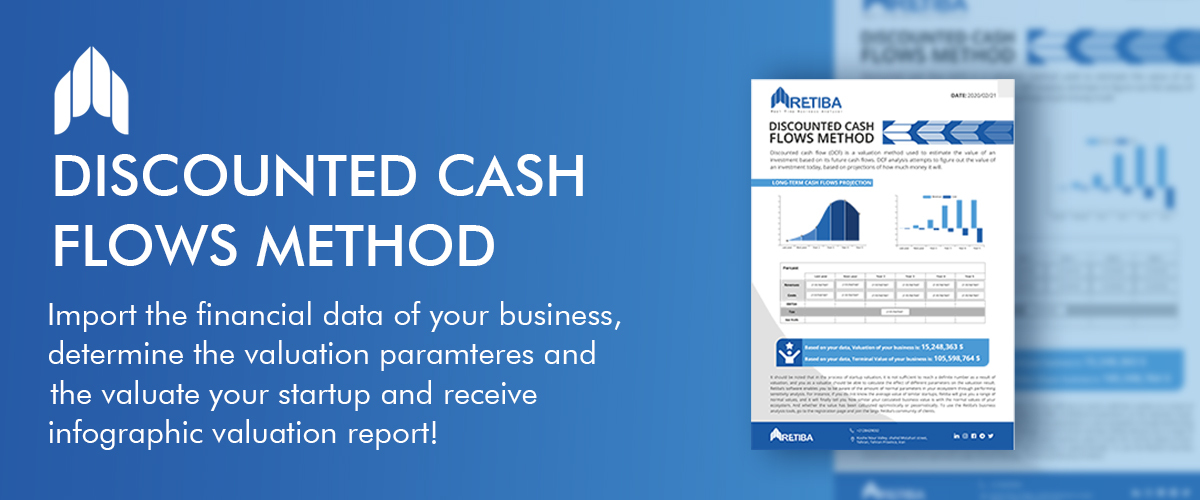
Your startup has crossed Death Valley, and it has had at least 2 funding rounds? Discounted Cash Flows (DCF)
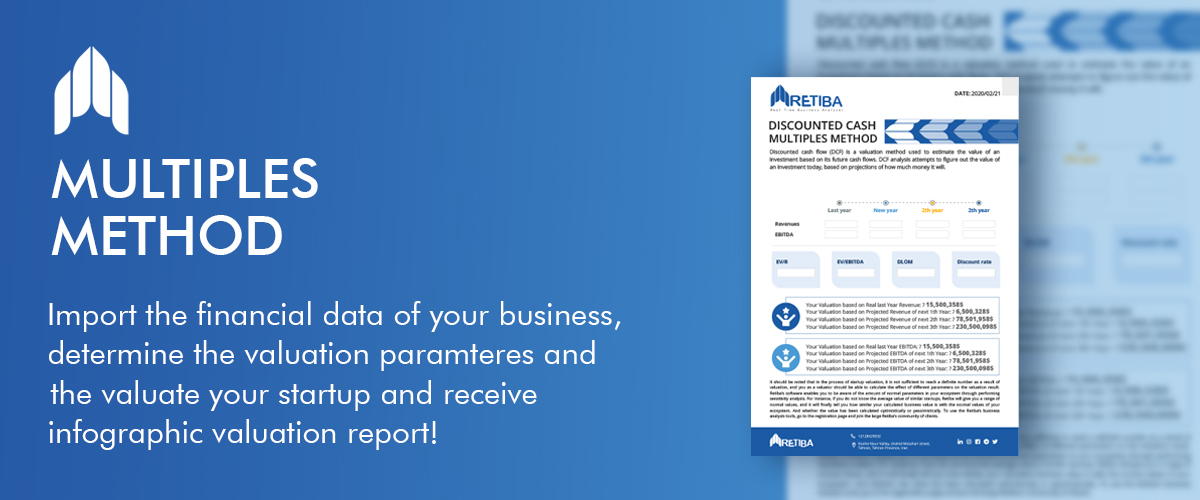
Your startup has had at least one funding round, you are advised to use Multiples method for valuation.
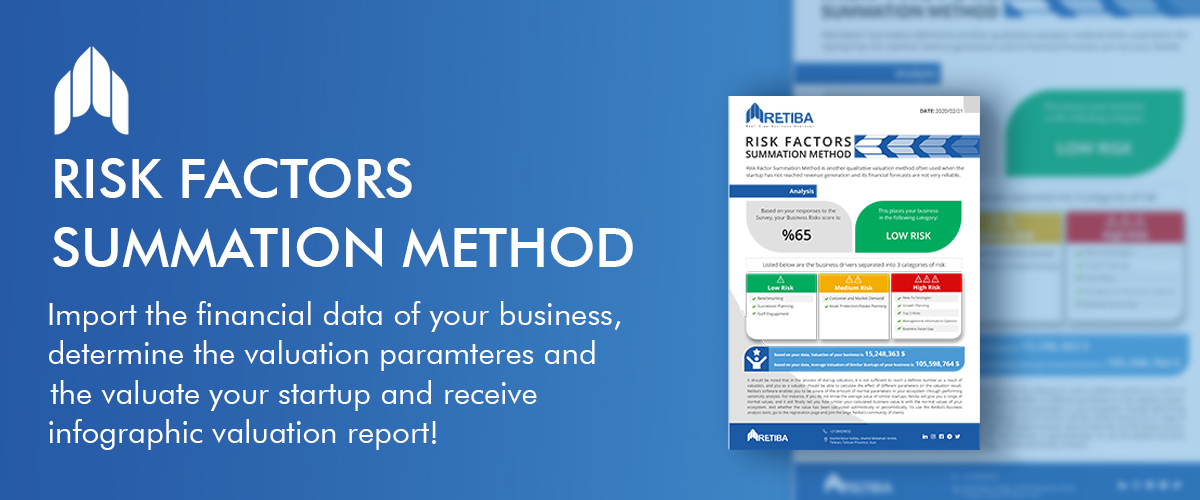
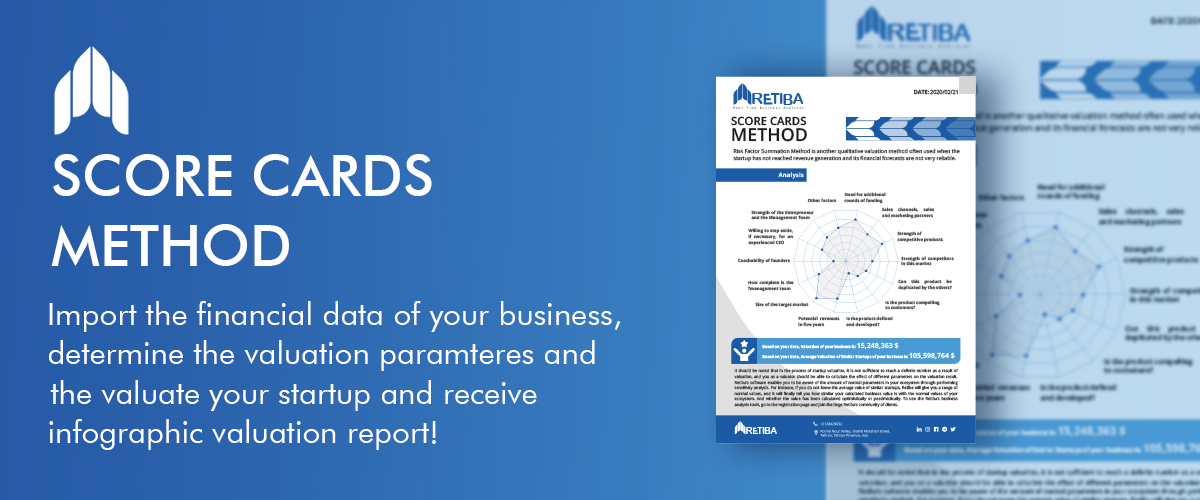
Your startup is at pre-seed and seed funding rounds, you are advised to use the Score Cards Method, Risk Factors Summation method to value your startup.